Abnormal Absorption Spectra on 10.1016/j.cej.2025.166173
Abnormal absorption spectra and incorrect Tauc Plots are observed in Figure 3 of the article [1].
The absorption spectra in Figure 3a show that the absorbance decreased as the wavelength decreased from 300 nm to 200 nm. However, for semiconductors like Bi2S3 and ZnFe2O4, the absorbance typically increases as the wavelength decreases from visual region to ultraviolet region. This discrepancy suggests that the data may be misused, or the experiments were not properly set up.
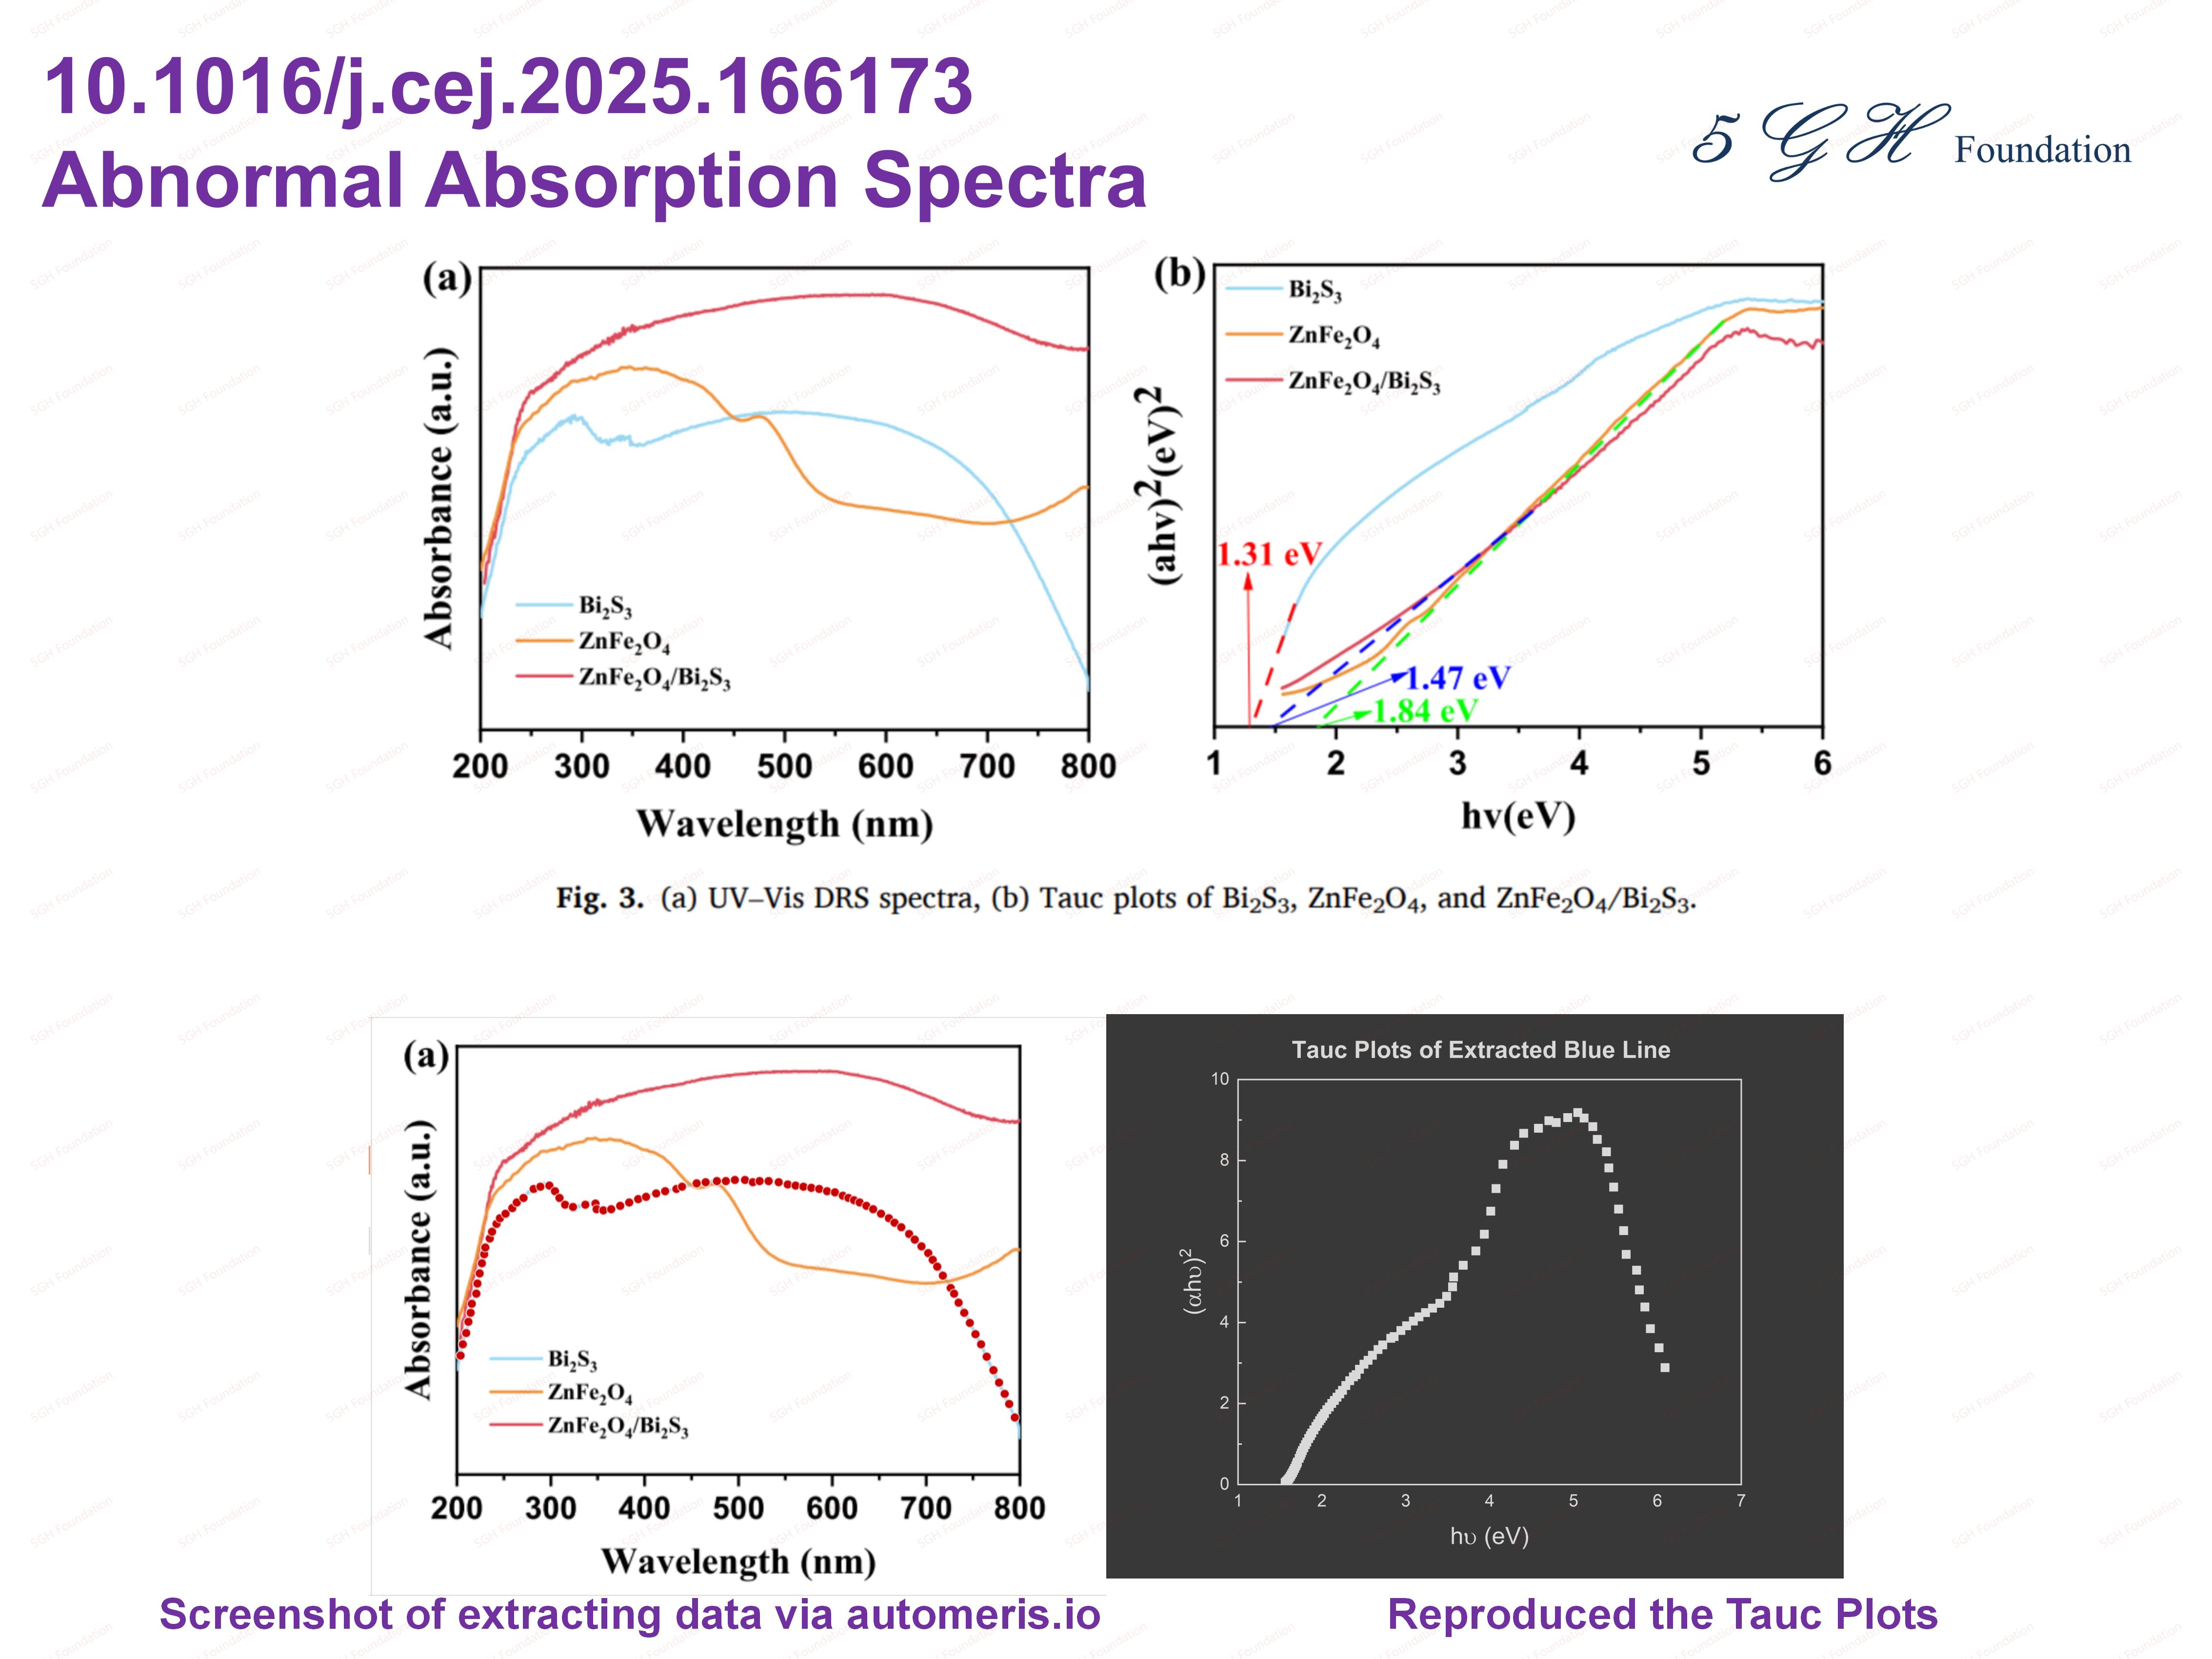
The Tauc Plots in Figure 3b appear to be incorrect. We extracted the data from the blue line (the data points are shown in lower-left panel [2]) by using automeris.io tool, and reploted the Tauc Plot. We assumed the absorbance values in Figure 3a ranges from to 0 to 100%. The resulting Tauc plot (shown in the lower-right panel) differs substantially to the one reported in the original article [1] (upper-right panel). Although the absorbance range in Figure 3a may affect the shape the reploted Tauc Plot, none of our attempts yielded a Tauc plot resembling the blue curve in Figure 3b. Furthermore, the red and yellow absorption spectra in Figure 3a exhibit markedly different profiles, yet their corresponding Tauc plots are similar to each other, such a discrepancy strongly suggests the Tauc plots in Figure 3b were not generated from the absorption spectra shown in Figure 3a.
These imply that the data in Figure 3 of the article [1] was manipulated.
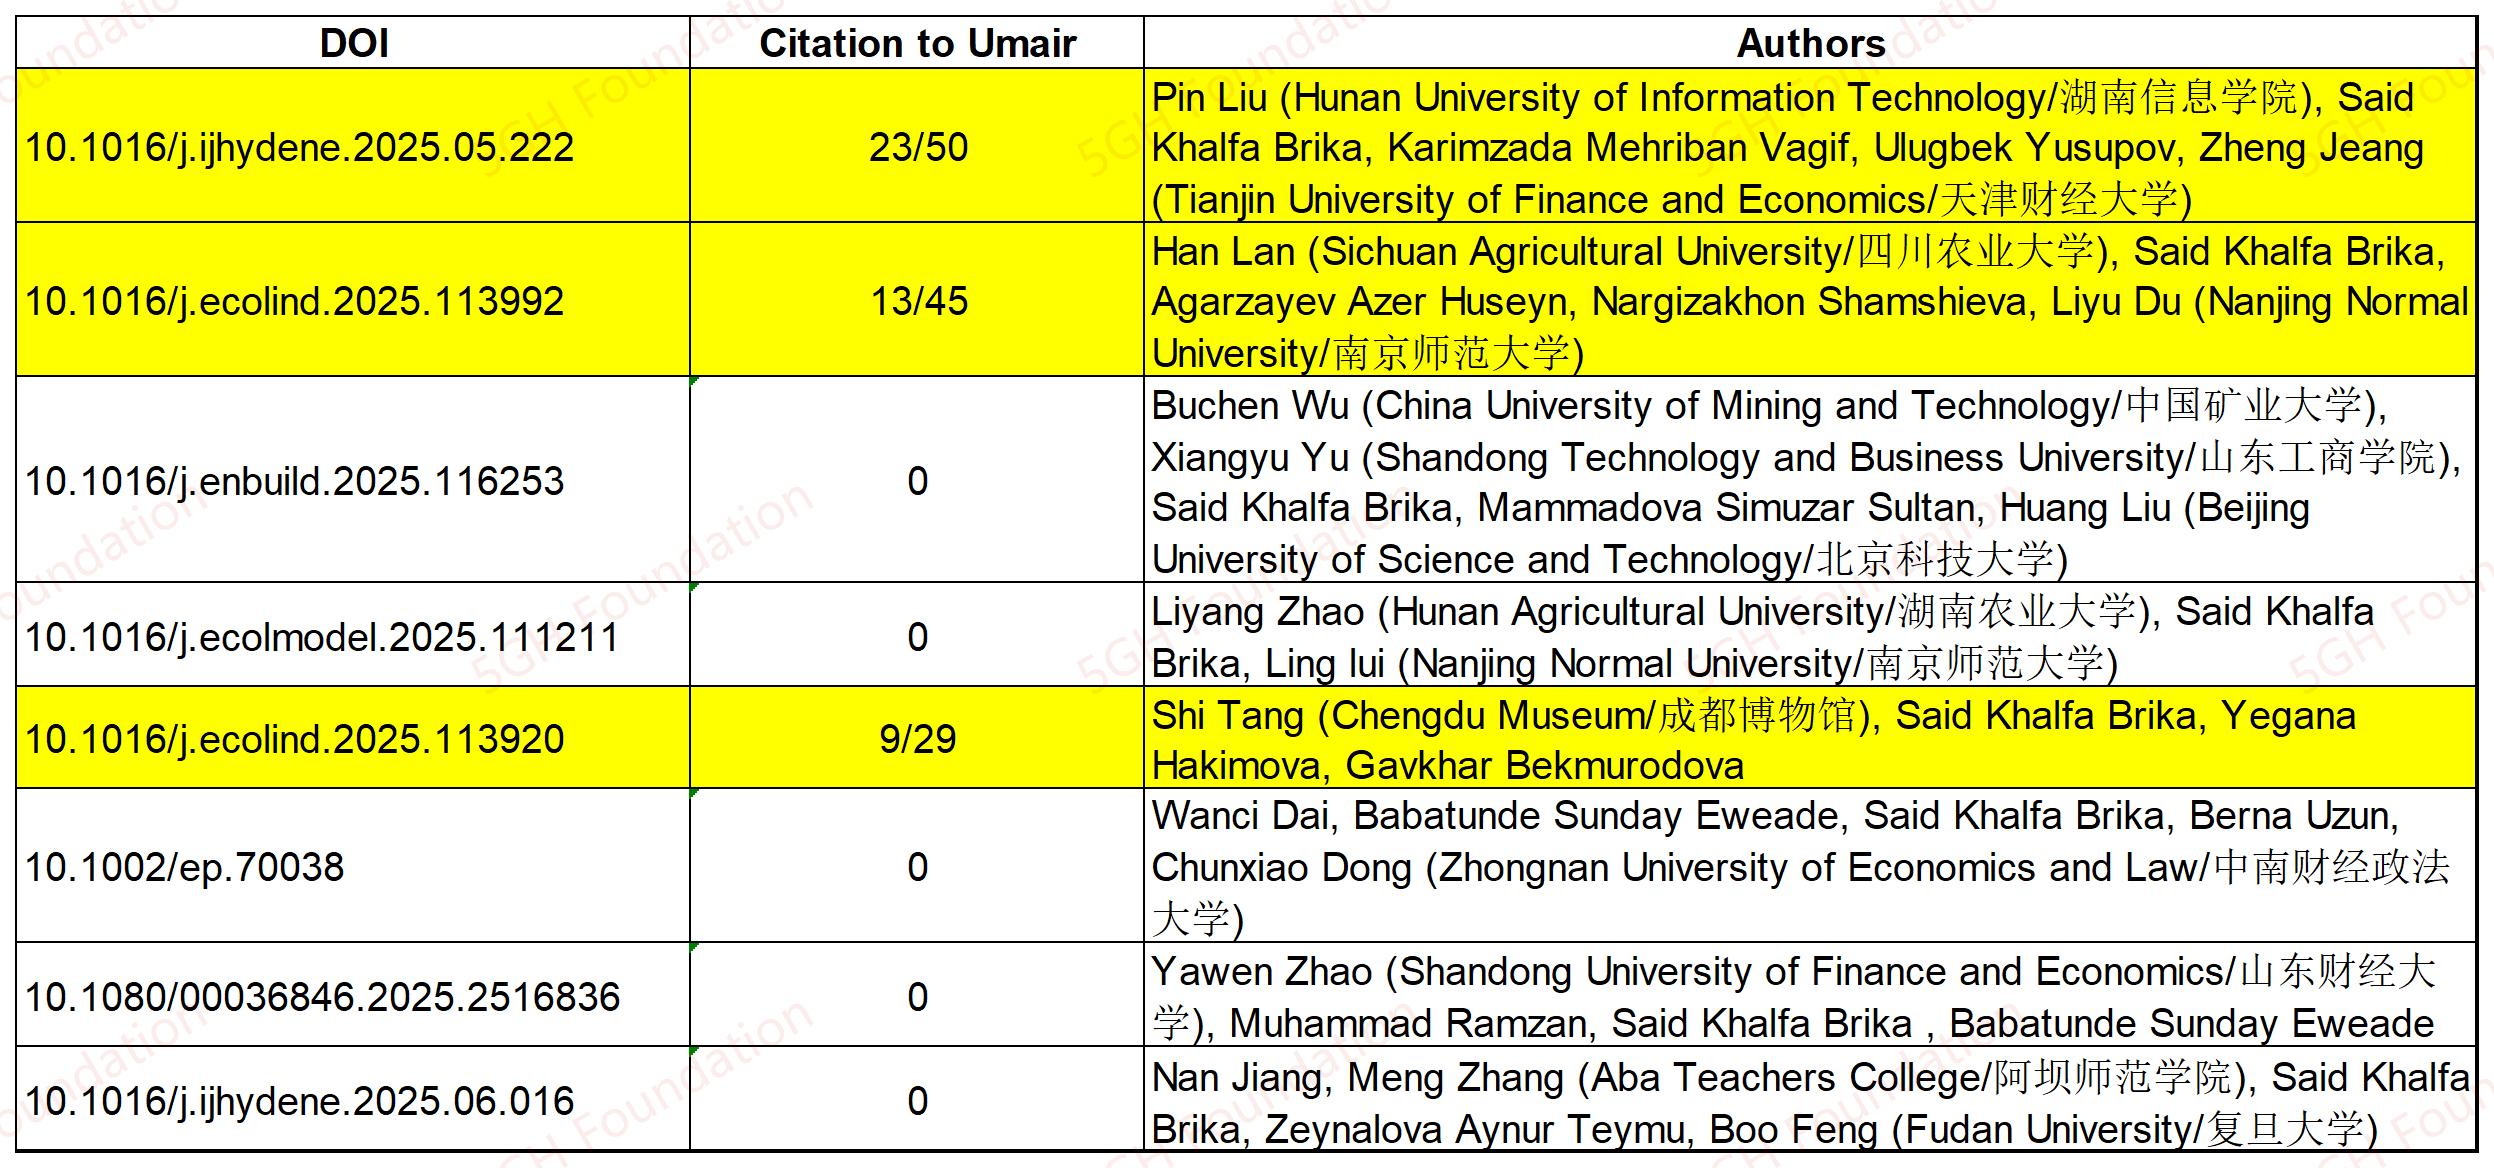
This article was coauthored by ZOU Rusen (邹如森), with Fuzhou University, a awardee of the Fujian "100 Talents Program".
Reference